THE RESEARCH SAFARI
  • Home
    • Knowledge Compass
    • Studyvibe
  • A-Z
  • Inquiry Process
    • The Research Grid
    • Key Stages of an Inquiry
    • Research Funnel
  • DEFINING
    • Mindmapping
    • Starburst Brainstorming
    • Graphic Organisers >
      • Student Showcase
    • Questions and Questioning >
      • Knowledge Compass
    • Research Task Verbs
  • LOCATING
    • Great Research Reference Sites
    • Searching the Web >
      • Boolean Searching
    • Searching with Google
    • Sources of Information
    • Website Evaluation
    • Fake websites
  • SELECTING
    • Content Curation
    • Creative Commons
    • Image Library
    • Notemaking >
      • Notemaking Apps and tools
      • Notemaking videos
    • Plagiarism
    • Referencing
  • ORGANISING
  • PRESENTING
    • Animation Tools >
      • Avatars
    • Brochure
    • Cartoon Makers
    • Digital Storytelling >
      • Digital Storytelling Resources
    • eBooks
    • Essay Writing
    • Infographics
    • Multimedia Presentations
    • Oral Presentations
    • Podcast
    • Posters >
      • Pic Collage Gallery
    • Website
  • EVALUATING
  • Mini Safaris
  • Trail Blazers
    • Trailblazer Subscription
    • The Ancient World >
      • Ancient China (Teachers)
      • Ancient China (Students)
      • Ancient Egypt
    • Bees >
      • Bees - Curriculum Links
    • Biomes >
      • Biomes - Curriculum Links
    • Cane Toads
    • Colonial Australia
    • Coral Reefs
    • Deserts
    • Dugongs
    • Government >
      • Government Curriculum Links
    • Great Pacific Garbage Patch
    • Introduced Species >
      • Introduced Species - Curriculum Links
    • Medieval Europe >
      • The Black Death
      • Christianity
      • Medieval Warfare
      • Curriculum Links
    • Rainforests
    • Renewable Energy >
      • Bioenergy
      • Geothermal Energy
      • Hydroelectric Power
      • Solar Energy
      • Wind Energy
    • Shogun Japan >
      • Gallery
    • Water >
      • Water images and infographics
      • Water Videos
      • Curriculum Links
    • Whales
  • Teacher Zone
    • All things Google
    • Australian Curriculum Links
    • Information Literacy Models
    • Information Literacy as a Transversal Competency
    • Infographic Library
    • Learning Frameworks
    • Project Websites
    • Real World Learning
    • Topic Ideas
    • Worksheet Library
  • Links
    • Knowledge Compass
    • Studyvibe
    • UN Sustainable Development Goals Project
    • Inspired Libraries Website
    • Teenage identity and Social Media

Infographics

Infographics or information graphics are visual representations of information, data or knowledge. These graphics are used where complex or large amounts of information needs to be explained quickly and clearly. It is like an online version of the poster you might find at school. For a more detailed explanation, take a look at the definition in Wikipedia.
Infographics can help you create dynamic assignments by adding pictorial representations of complex information.  For spatial (or visual) learners this is a great way to represent and learn information. 
Picture

Here is a list of some great resources that will help you create dynamic infographics.
​Canva
Canva’s infographic maker includes hundreds of free design elements, allowing you to experiment with data visualization like a professional
Visual.ly
Visual.ly is a new online application which allows you to create detailed data visualizations and infographics.
Easel.ly

A tool for creating infographics from scratch or by using some great templates.
​Venngage - another infographic creator

Resources

10 Awesome Free Tools to Make Infographics
This website is worth a look. It has an extensive list of online resources to help you create your own infographics.
20+ Tools to Create you Own Infographics
​
Here is an extensive list of Infographics tools
Kathy Shrock's Infographic Topics
An extensive list of examples to get you started
Cool Infographics
Gives great advice on the technical aspects like colour selection, layout etc.
Infographic Designs: Overview, examples and best practices
This is an excellent introduction to Infographics. Answers the What ? Why? and How?
10 Great Infographics
Here are some excellent examples of data being presented as an information graphic.
Picture
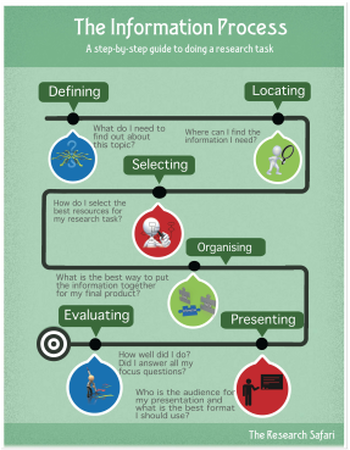
This infographic was made using Easel.ly
  • Home
    • Knowledge Compass
    • Studyvibe
  • A-Z
  • Inquiry Process
    • The Research Grid
    • Key Stages of an Inquiry
    • Research Funnel
  • DEFINING
    • Mindmapping
    • Starburst Brainstorming
    • Graphic Organisers >
      • Student Showcase
    • Questions and Questioning >
      • Knowledge Compass
    • Research Task Verbs
  • LOCATING
    • Great Research Reference Sites
    • Searching the Web >
      • Boolean Searching
    • Searching with Google
    • Sources of Information
    • Website Evaluation
    • Fake websites
  • SELECTING
    • Content Curation
    • Creative Commons
    • Image Library
    • Notemaking >
      • Notemaking Apps and tools
      • Notemaking videos
    • Plagiarism
    • Referencing
  • ORGANISING
  • PRESENTING
    • Animation Tools >
      • Avatars
    • Brochure
    • Cartoon Makers
    • Digital Storytelling >
      • Digital Storytelling Resources
    • eBooks
    • Essay Writing
    • Infographics
    • Multimedia Presentations
    • Oral Presentations
    • Podcast
    • Posters >
      • Pic Collage Gallery
    • Website
  • EVALUATING
  • Mini Safaris
  • Trail Blazers
    • Trailblazer Subscription
    • The Ancient World >
      • Ancient China (Teachers)
      • Ancient China (Students)
      • Ancient Egypt
    • Bees >
      • Bees - Curriculum Links
    • Biomes >
      • Biomes - Curriculum Links
    • Cane Toads
    • Colonial Australia
    • Coral Reefs
    • Deserts
    • Dugongs
    • Government >
      • Government Curriculum Links
    • Great Pacific Garbage Patch
    • Introduced Species >
      • Introduced Species - Curriculum Links
    • Medieval Europe >
      • The Black Death
      • Christianity
      • Medieval Warfare
      • Curriculum Links
    • Rainforests
    • Renewable Energy >
      • Bioenergy
      • Geothermal Energy
      • Hydroelectric Power
      • Solar Energy
      • Wind Energy
    • Shogun Japan >
      • Gallery
    • Water >
      • Water images and infographics
      • Water Videos
      • Curriculum Links
    • Whales
  • Teacher Zone
    • All things Google
    • Australian Curriculum Links
    • Information Literacy Models
    • Information Literacy as a Transversal Competency
    • Infographic Library
    • Learning Frameworks
    • Project Websites
    • Real World Learning
    • Topic Ideas
    • Worksheet Library
  • Links
    • Knowledge Compass
    • Studyvibe
    • UN Sustainable Development Goals Project
    • Inspired Libraries Website
    • Teenage identity and Social Media